Healthcare Revenue Cycle Analytics Dashboard
🛠 Tools Used






💡 Skills Demonstrated






📊 Project Description
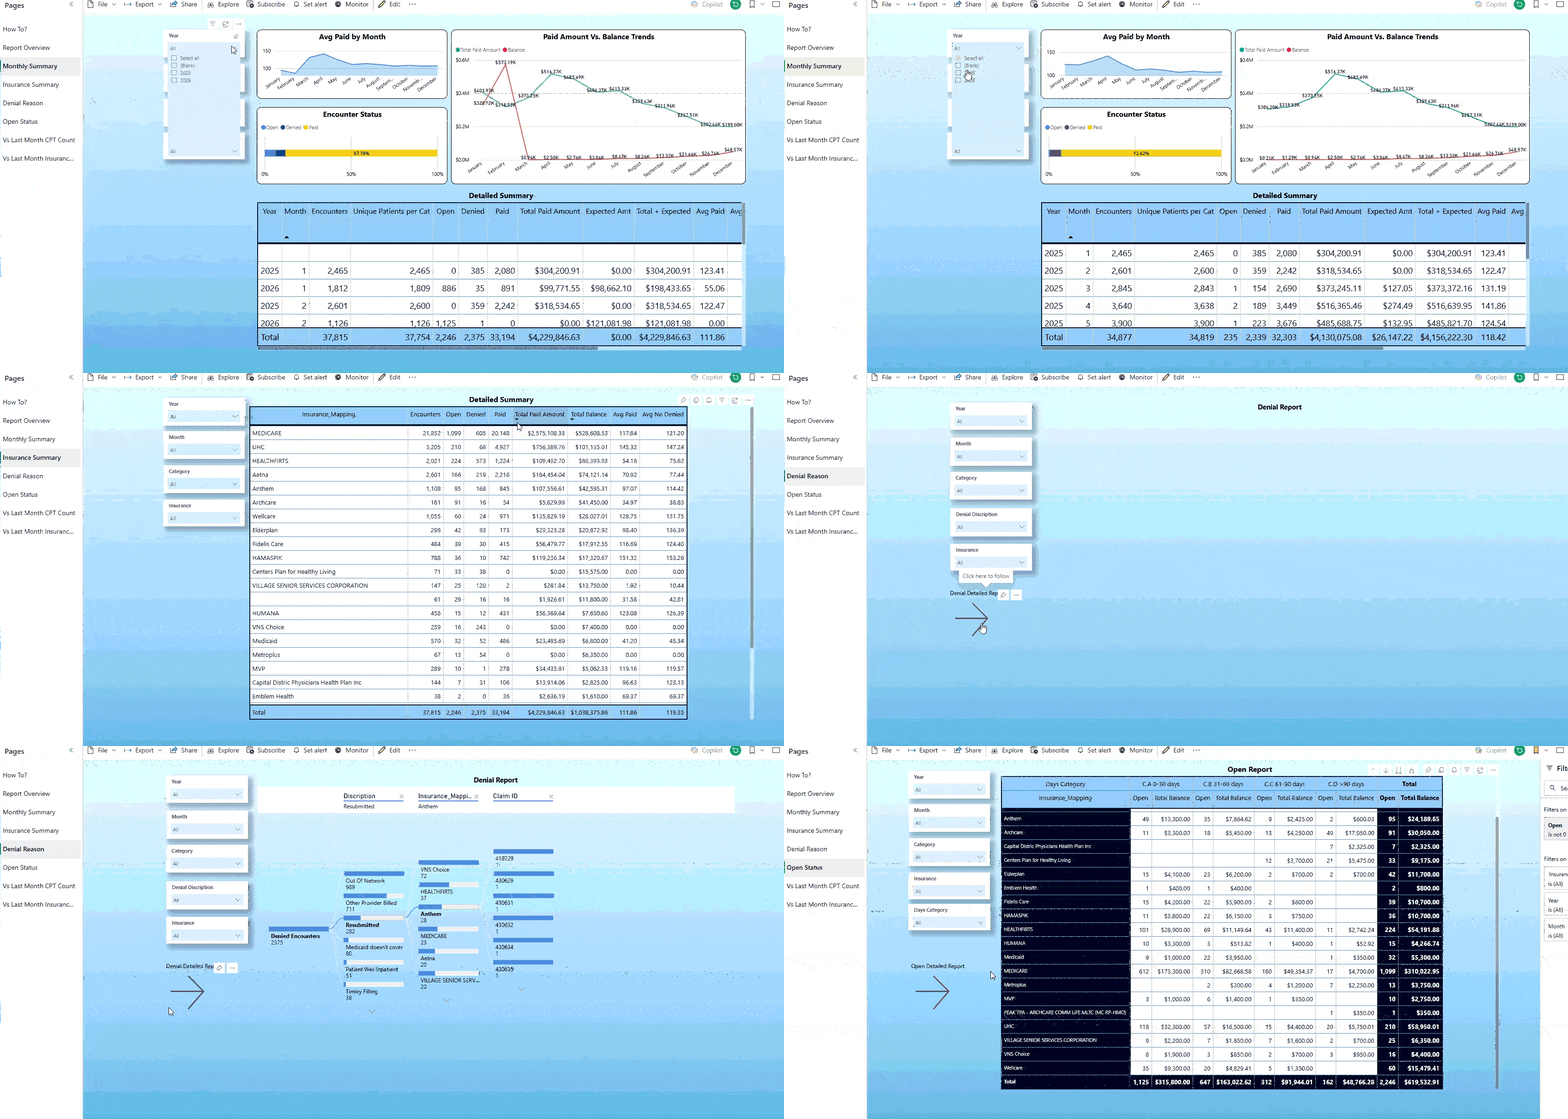
This Power BI dashboard provides a comprehensive view of healthcare billing and insurance claim performance, enabling healthcare administrators, revenue cycle teams, and practice managers to monitor financial outcomes and identify opportunities to improve collections. The solution consolidates patient encounter, insurance, payment, and claim status data into an interactive reporting platform that tracks reimbursement trends, claim denials, outstanding balances, and payment performance across different time periods and insurance providers. By transforming operational billing data into actionable insights, the dashboard helps healthcare organizations improve cash flow, reduce revenue leakage, and optimize claims management processes.
🎯 Business Problems Addressed
Healthcare providers often struggle with:
- Limited visibility into claim payment performance
- High claim denial rates affecting revenue
- Delays in reimbursement from insurance providers
- Difficulty tracking outstanding balances
- Manual reporting processes across multiple data sources
- Identifying trends in collections and payment efficiency
This dashboard centralizes key revenue cycle metrics to enable proactive decision-making and operational improvements.
❓ Key Business Questions Answered
Financial Performance
- How much revenue has been collected each month?
- What are the trends in paid amounts over time?
- How does actual payment compare to outstanding balances?
- Which periods generate the highest and lowest reimbursements?
Claims Management
- What percentage of encounters are Paid, Open, or Denied?
- Are denial rates increasing or decreasing over time?
- How many claims remain unresolved?
Insurance Analysis
- Which insurance providers generate the highest payments?
- Which insurers have the highest denial rates?
- Which payers contribute most to outstanding balances?
Operational Efficiency
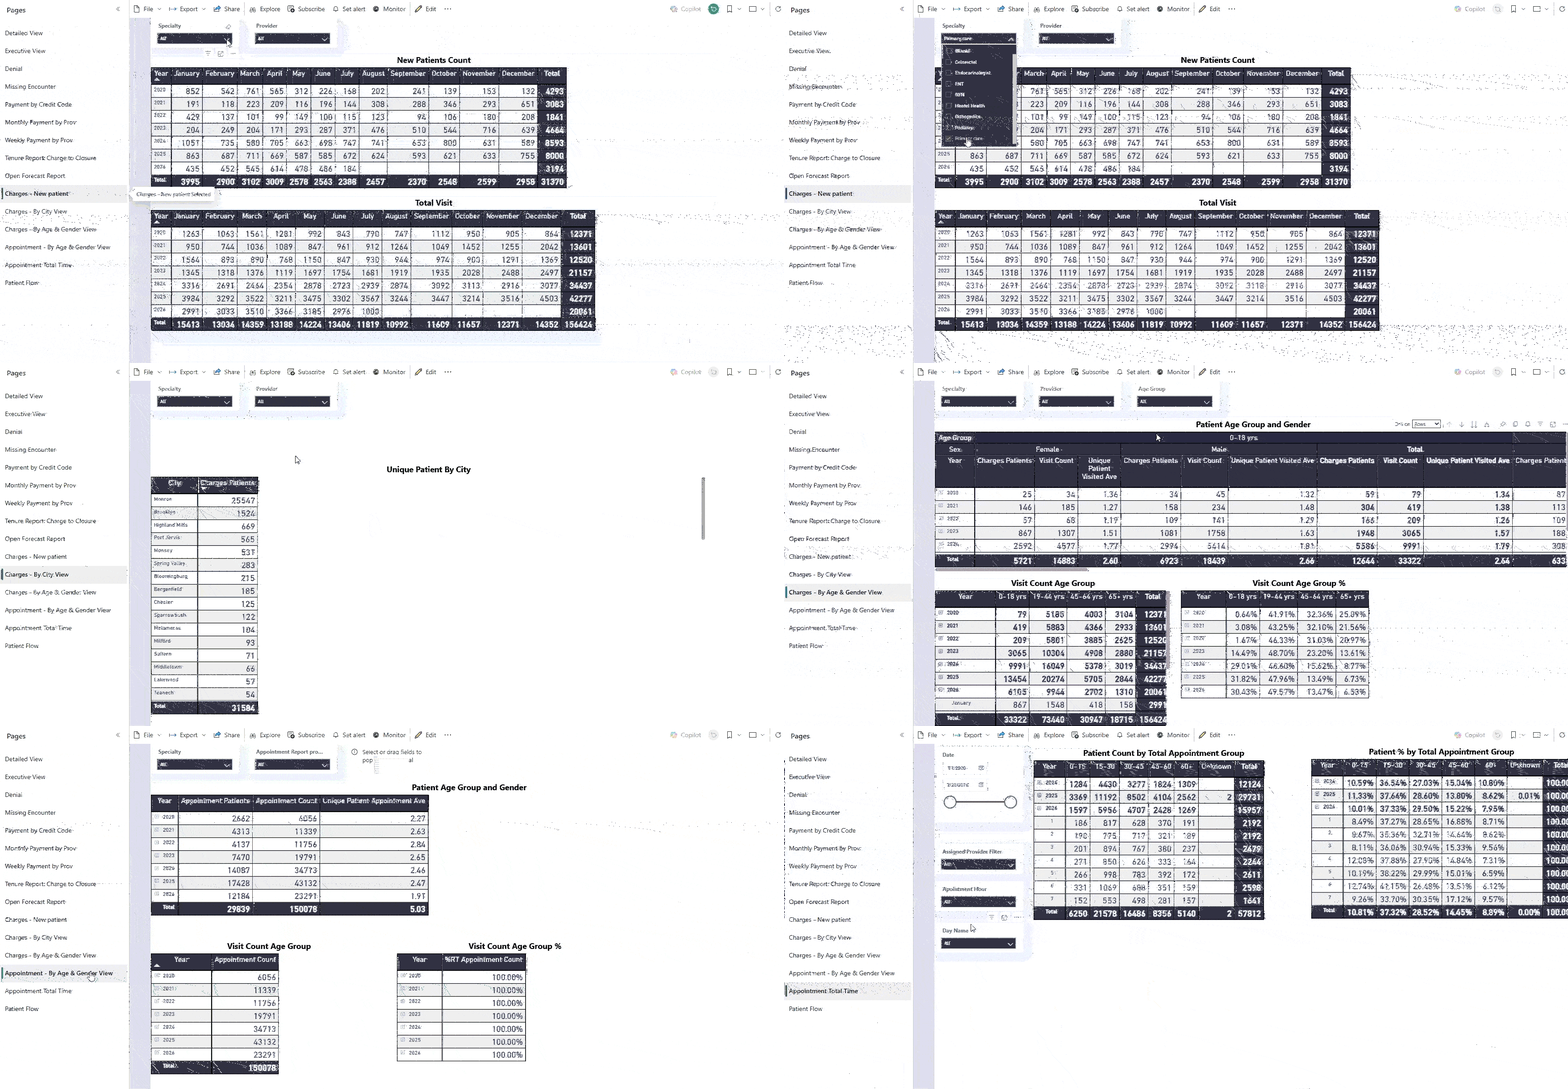
- How many patient encounters are processed monthly?
- How many unique patients are serviced?
- What is the average payment received per encounter?
- How effectively are claims converted into paid revenue?
📊 Dashboard Features
- ✅ Monthly reimbursement trend analysis
- ✅ Payment vs. balance comparison
- ✅ Claim status monitoring (Paid, Open, Denied)
- ✅ Insurance-level performance analysis
- ✅ Encounter volume tracking
- ✅ Revenue and collection KPIs
- ✅ Dynamic filtering by:
- Year
- Month
- Insurance Provider
- Service Category
✅ Detailed operational and financial summaries
Professional Experience
Dennis Toting
- 📈 10+ Years of Experience in Data Analytics, Reporting, and Business Intelligence
- ⚙️ 5+ Years of Experience in Data Engineering and ETL Development
- 📊 5+ Years of Experience in Business Intelligence, Dashboard Development, and Data Visualization